

Montego Capital Fund 2
Activity Update
Stay connected to your investment with monthly updates from Montego Minerals, including portfolio insights, operator activity, and market trends, providing helpful context behind your distributions.
Activity Update Video
This month’s Montego Investor Education Series features Taylor St. Germain of ITR Economics, who shares key leading indicators signaling a potential downturn in the global economy and what investors should be watching today.
Taylor discusses the economic trends shaping the road ahead and practical ways investors can begin preparing their portfolios for changing market conditions.
This continuing education series is designed to give Montego investors access to leading-edge economic insights and information to help them make informed investment decisions for the future.
2026 MONTEGO CAPITAL FUND 2 PORTFOLIO RETURNS
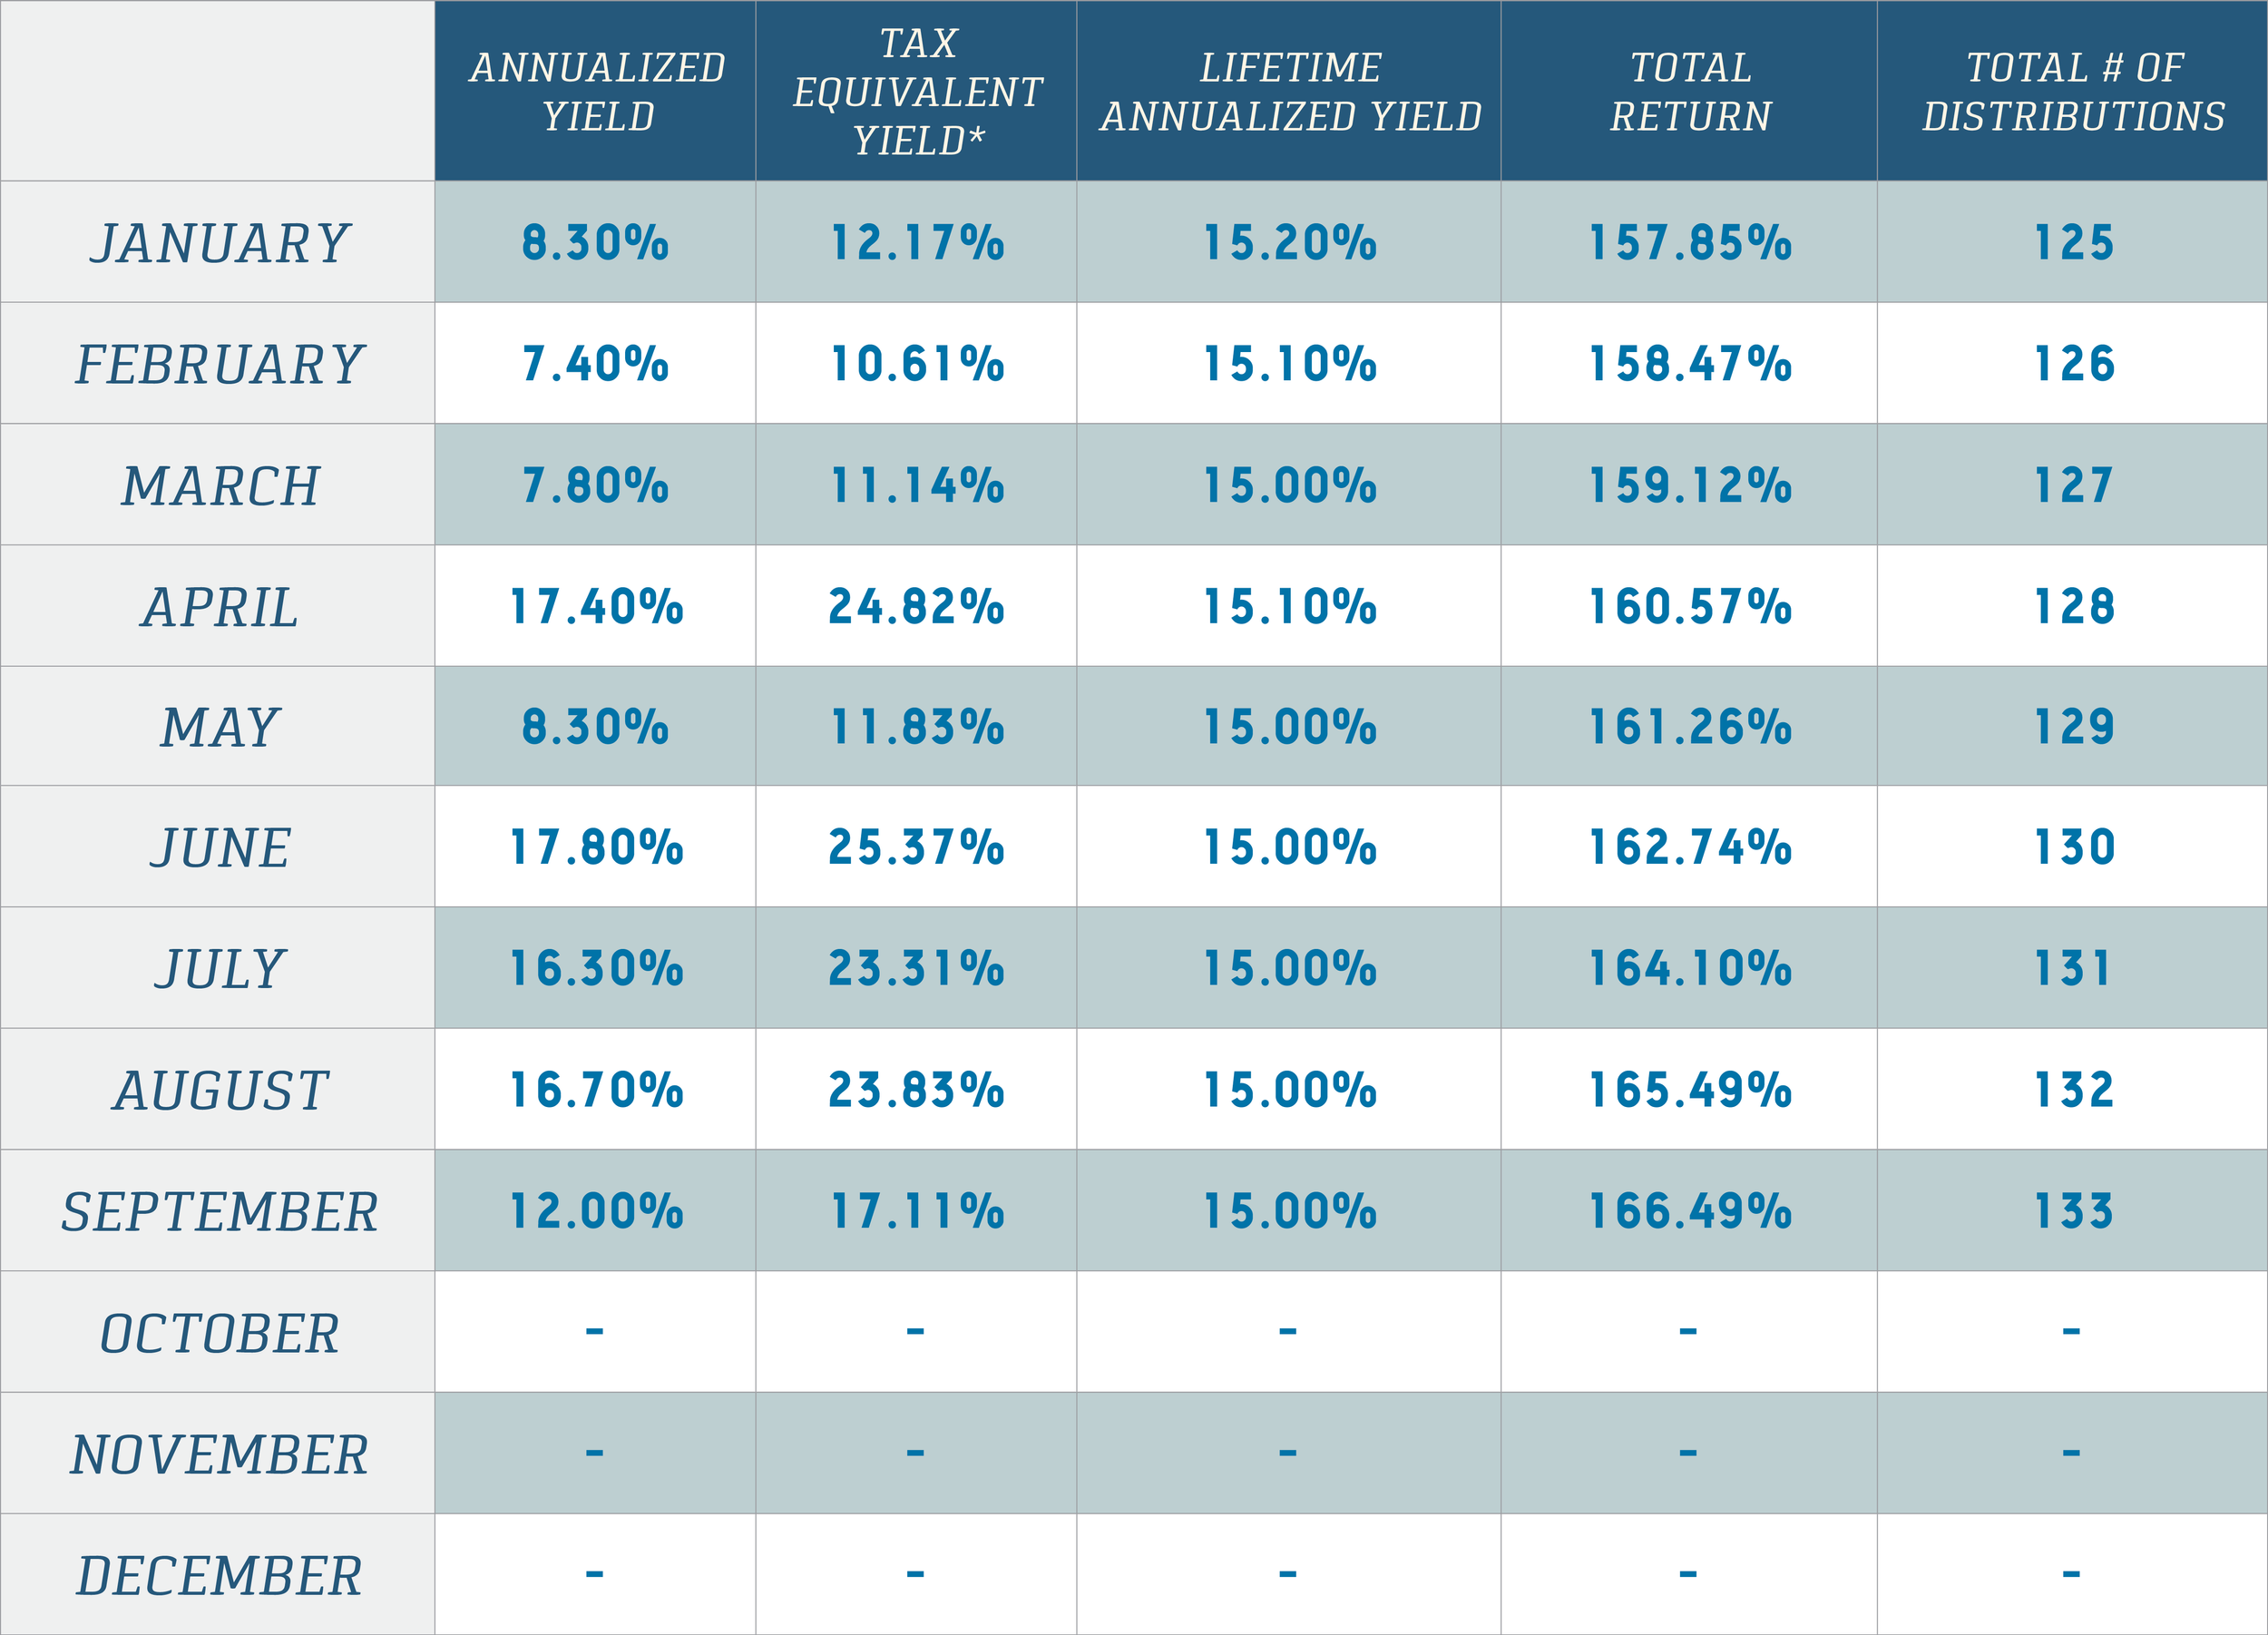
What These Metrics Mean
Annualized Yield - An estimate of the yearly cash return based on distributions received so far.
Tax-Equivalent Yield - Estimates assume a 30% effective tax rate and remaining depreciable basis. Investors participating via a 1031 exchange generally have a reduced tax basis, which may limit the impact of cost depletion and reduce the relevance of tax-equivalent yield. Consult your tax advisor when reviewing Montego’s depletion schedules.
Lifetime Annualized Yield - The average annual cash return since the investment began.
Total Return - The total performance of the investment, including all distributions received to date.
Portfolio Insights
This section provides ongoing insights into portfolio performance, distribution trends, and current oil and natural gas market conditions to help you better understand the factors influencing your investment.
-
Portfolio distributions totaled $81,167.04. Payments from Diamondback E&P and other operators reflected lower oil prices for the production months paid. Mewbourne Oil Company made its largest payment to the fund to date as natural gas from one of its wells entered pay for the first time. Realized oil pricing averaged $86.25 per barrel, and natural gas pricing improved modestly as regional takeaway conditions eased.
-
Oil prices moved sharply through August as disruptions to Middle East production and shipping continued to constrain global supply. WTI at Cushing fell into the upper $70s early in the month, climbed to nearly $90 per barrel by August 20, and settled back into the mid $80s during the final full week. The EIA estimates that 6.7 million barrels per day of crude production was shut in during August. Looking ahead, the pace at which Middle East shipments and production resume remains a key influence on prices.
Benchmark: WTI at Cushing averaged approximately $84.62 per barrel. -
Natural gas prices were steadier in August. Henry Hub traded mostly in the upper $2 range per million British thermal units as growing U.S. production supported storage injections ahead of winter. The EIA expects Permian and Haynesville production to drive much of the supply growth, while new pipeline capacity is helping move more Permian gas to market. Regional prices can still differ from Henry Hub, particularly for Permian wells, so the effect on royalty payments varies by operator and production month. Weather, winter demand, and storage levels will be important factors in the months ahead.
Benchmark: Henry Hub averaged approximately $2.81 per MMBtu.
-
The commodity prices referenced in this update are based on actual operator payments received during the distribution cycle.
Because operators report and remit revenue on different schedules, realized prices may not perfectly align with published market averages for any single month. These figures should be viewed as a general indicator of pricing trends across the portfolio rather than an exact measure of market prices during a specific production period.
